Data
The following provides an overview of the data sections within the ETE Dashboard
Tracking ETE
Ending the Epidemic Metrics
Achieve fewer new HIV infections than deaths by 2020
2020 New HIV Infections 1,467 | 2020 Deaths among PLWDH 2,367
Measures: NYS DOH ETE Metrics
Years: 2013 – 2020
Geographic levels: NYS statewide and NYC citywide
Filters: sex, age, race/ethnicity
Tracking the HIV/AIDS Epidemic (NYS)
Measures: New HIV diagnoses, New AIDS diagnoses, PLWDH, Viral suppression among PLWDH
Years: 2010-2020
Geographic levels: NYS statewide, Ryan White Region, county
Filters: sex, age, race, risk
Tracking the HIV/AIDS Epidemic (NYC)
Measures: New HIV diagnoses, New AIDS diagnoses, Number of deaths among PLWDH, PLWDH, Viral suppression among PLWDH
Years: 2010-2020
Geographic levels: NYC citywide, borough, UHF neighborhood
Filters: gender, age, race, risk
Prevention
PrEP Use (NYS)
39,282 individuals who filled PrEP prescriptions in 2020
Measures: Persons who filled at least one PrEP prescription
Years: 2014 – 2020
Geographic levels: NYS statewide, Ryan White Region, NYC citywide, borough
Filters: sex, age, race/ethnicity, coverage type (Medicaid/Non-Medicaid)
PEP Use (NYS)
2,892 Medicaid recipients who filled PEP prescriptions in 2020
Measures: Medicaid-insured persons who filled at least one PEP prescription
Years: 2012 – 2020
Geographic levels: NYS statewide, Ryan White Region, NYC citywide, borough
Filters: Medicaid group, age, gender, race/ethnicity
Regional PrEP Aware Fact Sheets
10,719 Persons on PrEP in 2020 in NYS (outside of NYC)
Measures: Persons on PrEP
Years: 2017 – 2020
Geographic levels: Ryan White Region
Filters: sex, age, race/ethnicity
Condom Use (NYC)
29% of NYC residents used a condom at last sex
54% of NYC residents with 3+ sex partners used a condom at last sex
Measures: Condom use at last sex
Years: 2013 – 2020
Geographic levels: NYC citywide, borough
Filters: sex, age, race/ethnicity, among MSM, number of sex partners
Perinatal Infections (NYS)
99% decrease in the number of newborns with perinatal HIV infection from 1997-2020
Measures: Perinatal HIV transmission and rate of newborns with perinatal HIV infection
Years: 1997 – 2020
Geographic levels: NYS statewide
Filters: None
Sexually Transmitted Infections (NYS)
2,864 Primary and Secondary Syphilis diagnoses
40,896 Gonorrhea diagnoses
124,389 Chlamydia diagnoses
Measures: STI diagnoses (link to the NYS STI Surveillance Report)
New Infections
Estimated New HIV Infections (NYS)
1,467 estimated new HIV infections in NYS (2020)
Measures: New HIV infections (incidence)
Years: 2013 – 2020
Geographic levels: NYS statewide, NYC citywide
Filters: None
Testing
HIV Testing (NYS)
53% of New Yorkers ever tested for HIV
Measures: Ever tested for HIV, tested for HIV in the past 12 months
Years: 2011 – 2019
Geographic levels: NYS statewide, Ryan White Region
Filters: sex, age, race/ethnicity, risk (MSM)
HIV Testing (NYC)
30% NYC residents tested in the last 12 months
Measures: Tested for HIV in the last 12 months, never tested
Years: 2007 – 2020
Geographic levels: NYC citywide, borough, UHF neighborhood
Filters: sex, age, race/ethnicity, risk (MSM)
New Diagnoses and Linkage to Care
HIV Care Continuum among People Newly Diagnosed with HIV (NYS)
Measures: New HIV diagnoses, linkage to care within 3 months/30 days, viral suppression within 3/6/12 months of diagnosis
Years: 2010 – 2020
Geographic levels: NYS statewide, Ryan White Region, county
Filters: age, race, risk
HIV Care Continuum among People Newly Diagnosed with HIV (NYC)
Measures: New HIV diagnoses, linkage to care within 3 months/30 days, viral suppression within 3/6/12 months of diagnosis
Years: 2010 – 2020
Geographic levels: NYC citywide, borough, UHF neighborhood
Filters: gender, age, race, risk
Trends among New HIV Diagnoses (NYS)
1,930 newly diagnosed in NYS (2020)
Measures: New HIV diagnoses, concurrent HIV/AIDS diagnoses, linkage to care within 30 days/3 months/12 months, viral suppression within 3/6/12 months of diagnosis
Years: 2010 – 2020
Geographic levels: NYS statewide, Ryan White Region, county
Filters: sex, age, race, risk
Trends among New HIV Diagnoses (NYC)
1,394 newly diagnosed in NYC (2020)
Measures: New HIV diagnoses, concurrent HIV/AIDS diagnoses, linkage to care within 30 days/3 months/12 months, viral suppression within 3/6/12 months of diagnosis, median CD4 count at diagnosis
Years: 2010 – 2020
Geographic levels: NYC citywide, borough, UHF Neighborhood
Filters: sex, age, race, risk
Median CD4 Count at Diagnosis (NYS)
391 Median CD4 count at diagnosis in 2020
Measures: Median CD4 count at diagnosis
Years: 2010 – 2020
Geographic levels: NYS statewide, Ryan White Region
Filters: None
Prevalence and Care
HIV Care Continuum among People Living with HIV (NYS)
Measures: People living with HIV, evidence of care, retention in care, viral suppression
Years: 2012 – 2020
Geographic levels: NYS statewide, Ryan White Region, county
Filters: sex, age, race/ethnicity, risk
HIV Care Continuum among People Living with HIV (NYC)
Measures: People living with HIV, evidence of care, retention in care, viral suppression
Years: 2012 – 2020
Geographic levels: NYC citywide, borough, UHF Neighborhood
Filters: gender, age, race/ethnicity, risk
NYS Quality Corner: Organizational HIV Treatment Cascades
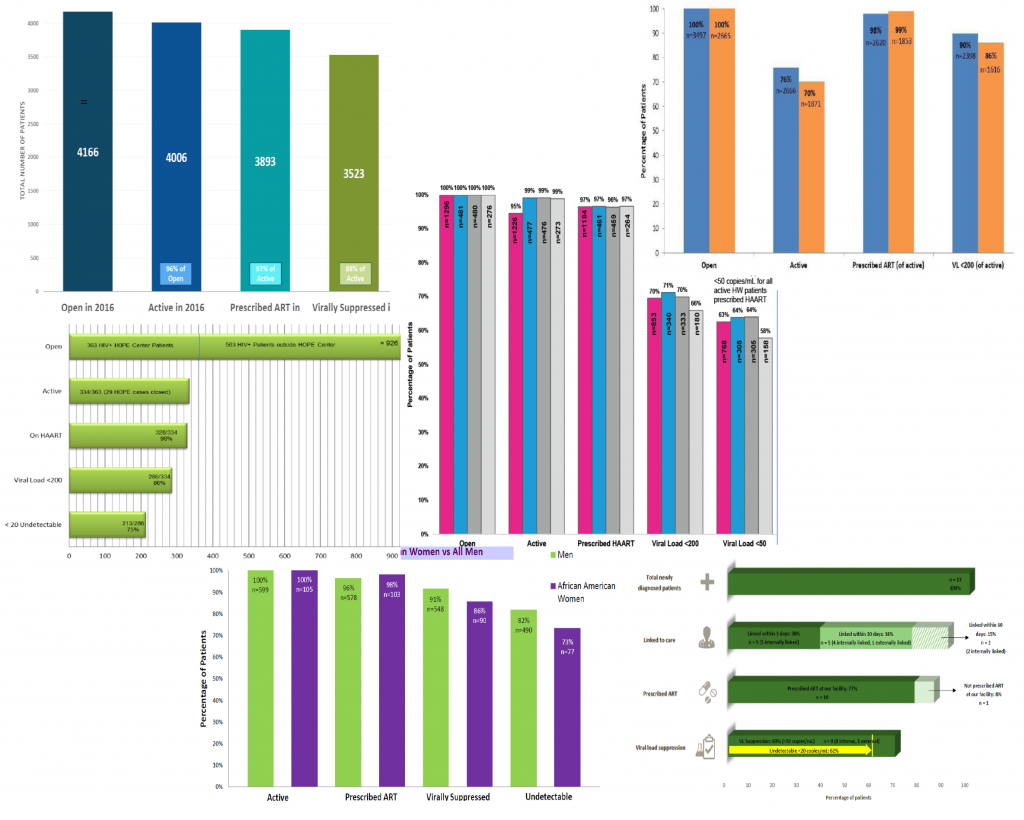
Measures: HIV treatment cascades for 13 HIV care providers in NYS, beginning with all PLWDH who recieved any service from said care provider during the calendar year
Years: 2016
Geographic levels: NYS statewide
Filters: None
AIDS Diagnoses
New AIDS Diagnoses (NYS)
864 New AIDS diagnoses in 2020
Measures: New AIDS diagnoses
Years: 2010 – 2020
Geographic levels: NYS statewide, Ryan White Region, county
Filters: sex, age, race/ethnicity, risk
New AIDS Diagnoses (NYC)
916 New AIDS diagnoses in 2020
Measures: New AIDS diagnoses
Years: 2010 – 2020
Geographic levels: NYC citywide, borough, UHF neighborhood
Filters: gender, age, race, risk
Deaths and Hospitalizations
Deaths among PLWH (NYS)
24% of deaths among PLWH directly related to HIV (2019)
Measures: Number of deaths among PLWH, Percentage of deaths directly related to HIV/AIDS
Years: 2014 – 2020
Geographic levels: NYS statewide
Filters: none
Deaths among PLWDH (NYC)
2.3 deaths per 1,000 PLWDH due to an HIV-related cause (2019)
Measures: Number of deaths among PLWDH, death rate among PLWDH, death rate due to HIV-related cause, and death rate due to non-HIV-related cause
Years: 2010 – 2020
Geographic levels: NYC citywide, borough, UHF Neighborhood
Filters: gender, age, race, risk
HIV/AIDS-associated Hospitalizations (NYS)
59.1 hospitalizations per 1,000 PLWDH (2017)
Measures: Number of HIV/AIDS-related hospitalizations, rate of HIV/AIDS-related hospitalizations among total pop, rate of HIV/AIDS-related hospitalizations among PLWDH
Years: 2009 – 2017
Geographic levels: NYS statewide, Ryan White Region, county
Filters: sex, age, race/ethnicity
Tracking ETE
Ending the Epidemic Metrics
Achieve fewer new HIV infections than deaths by 2020
2020 New HIV Infections 1,467 | 2020 Deaths among PLWDH 2,367
Measures: NYS DOH ETE Metrics
Years: 2013 – 2020
Geographic levels: NYS statewide and NYC citywide
Filters: sex, age, race/ethnicity
Tracking the HIV/AIDS Epidemic (NYS)
Measures: New HIV diagnoses, New AIDS diagnoses, PLWDH, Viral suppression among PLWDH
Years: 2010-2020
Geographic levels: NYS statewide, Ryan White Region, county
Filters: sex, age, race, risk
Tracking the HIV/AIDS Epidemic (NYC)
Measures: New HIV diagnoses, New AIDS diagnoses, Number of deaths among PLWDH, PLWDH, Viral suppression among PLWDH
Years: 2010-2020
Geographic levels: NYC citywide, borough, UHF neighborhood
Filters: gender, age, race, risk
Prevention
PrEP Use (NYS)
39,282 individuals who filled PrEP prescriptions in 2020
Measures: Persons who filled at least one PrEP prescription
Years: 2014 – 2020
Geographic levels: NYS statewide, Ryan White Region, NYC citywide, borough
Filters: sex, age, race/ethnicity, coverage type (Medicaid/Non-Medicaid)
PEP Use (NYS)
2,892 Medicaid recipients who filled PEP prescriptions in 2020
Measures: Medicaid-insured persons who filled at least one PEP prescription
Years: 2012 – 2020
Geographic levels: NYS statewide, Ryan White Region, NYC citywide, borough
Filters: Medicaid group, age, gender, race/ethnicity
Regional PrEP Aware Fact Sheets
10,719 Persons on PrEP in 2020 in NYS (outside of NYC)
![]()
Measures: Persons on PrEP
Years: 2017 – 2020
Geographic levels: Ryan White Region
Filters: sex, age, race/ethnicity
Condom Use (NYC)
29% of NYC residents used a condom at last sex
54% of NYC residents with 3+ sex partners used a condom at last sex
Measures: Condom use at last sex
Years: 2013 – 2020
Geographic levels: NYC citywide, borough
Filters: sex, age, race/ethnicity, among MSM, number of sex partners
Perinatal Infections (NYS)
99% decrease in the number of newborns with perinatal HIV infection from 1997-2020
Measures: Perinatal HIV transmission and rate of newborns with perinatal HIV infection
Years: 1997 – 2020
Geographic levels: NYS statewide
Filters: None
Sexually Transmitted Infections (NYS)
2,864 Primary and Secondary Syphilis diagnoses
40,896 Gonorrhea diagnoses
124,389 Chlamydia diagnoses
![]()
Measures: STI diagnoses (link to the NYS STI Surveillance Report)
New Infections
Estimated New HIV Infections (NYS)
1,467 estimated new HIV infections in NYS (2020)
Measures: New HIV infections (incidence)
Years: 2013 – 2020
Geographic levels: NYS statewide, NYC citywide
Filters: None
Testing
HIV Testing (NYS)
53% of New Yorkers ever tested for HIV
Measures: Ever tested for HIV, tested for HIV in the past 12 months
Years: 2011 – 2019
Geographic levels: NYS statewide, Ryan White Region
Filters: sex, age, race/ethnicity, risk (MSM)
HIV Testing (NYC)
30% NYC residents tested in the last 12 months
Measures: Tested for HIV in the last 12 months, never tested
Years: 2007 – 2020
Geographic levels: NYC citywide, borough, UHF neighborhood
Filters: sex, age, race/ethnicity, risk (MSM)
New Diagnoses and Linkage to Care
HIV Care Continuum among People Newly Diagnosed with HIV (NYS)
Measures: New HIV diagnoses, linkage to care within 3 months/30 days, viral suppression within 3/6/12 months of diagnosis
Years: 2010 – 2020
Geographic levels: NYS statewide, Ryan White Region, county
Filters: sex, age, race, risk
HIV Care Continuum among People Newly Diagnosed with HIV (NYC)
Measures: New HIV diagnoses, linkage to care within 3 months/30 days, viral suppression within 3/6/12 months of diagnosis
Years: 2010 – 2020
Geographic levels: NYC citywide, borough, UHF neighborhood
Filters: gender, age, race, risk
Trends among New HIV Diagnoses (NYS)
1,930 newly diagnosed in NYS (2020)
Measures: New HIV diagnoses, concurrent HIV/AIDS diagnoses, linkage to care within 30 days/3 months/12 months, viral suppression within 3/6/12 months of diagnosis
Years: 2010 – 2020
Geographic levels: NYS statewide, Ryan White Region, county
Filters: sex, age, race, risk
Trends among New HIV Diagnoses (NYC)
1,394 newly diagnosed in NYC (2020)
Measures: New HIV diagnoses, concurrent HIV/AIDS diagnoses, linkage to care within 30 days/3 months/12 months, viral suppression within 3/6/12 months of diagnosis, median CD4 count at diagnosis
Years: 2010 – 2020
Geographic levels: NYC citywide, borough, UHF Neighborhood
Filters: sex, age, race, risk
Median CD4 Count at Diagnosis (NYS)
391 Median CD4 count at diagnosis in 2020
Measures: Median CD4 count at diagnosis
Years: 2010 – 2020
Geographic levels: NYS statewide, Ryan White Region
Filters: None
Prevalence and Care
HIV Care Continuum among People Living with HIV (NYS)
Measures: People living with HIV, evidence of care, retention in care, viral suppression
Years: 2012 – 2020
Geographic levels: NYS statewide, Ryan White Region, county
Filters: sex, age, race/ethnicity, risk
HIV Care Continuum among People Living with HIV (NYC)
Measures: People living with HIV, evidence of care, retention in care, viral suppression
Years: 2012 – 2020
Geographic levels: NYC citywide, borough, UHF Neighborhood
Filters: gender, age, race/ethnicity, risk
NYS Quality Corner: Organizational HIV Treatment Cascades
Measures: HIV treatment cascades for 13 HIV care providers in NYS, beginning with all PLWDH who recieved any service from said care provider during the calendar year
Years: 2016
Geographic levels: NYS statewide
Filters: None
AIDS Diagnoses
New AIDS Diagnoses (NYS)
864 New AIDS diagnoses in 2020
Measures: New AIDS diagnoses
Years: 2010 – 2020
Geographic levels: NYS statewide, Ryan White Region, county
Filters: sex, age, race/ethnicity, risk
New AIDS Diagnoses (NYC)
916 New AIDS diagnoses in 2020
Measures: New AIDS diagnoses
Years: 2010 – 2020
Geographic levels: NYC citywide, borough, UHF neighborhood
Filters: gender, age, race, risk
Deaths and Hospitalizations
Deaths among PLWH (NYS)
24% of deaths among PLWH directly related to HIV (2019)
Measures: Number of deaths among PLWH, Percentage of deaths directly related to HIV/AIDS
Years: 2014 – 2020
Geographic levels: NYS statewide
Filters: None
Deaths among PLWDH (NYC)
2.3 deaths per 1,000 PLWDH due to an HIV-related cause (2019)
Measures: Number of deaths among PLWDH, death rate among PLWDH, death rate due to HIV-related cause, and death rate due to non-HIV-related cause
Years: 2010 – 2020
Geographic levels: NYC citywide, borough, UHF Neighborhood
Filters: gender, age, race, risk
HIV/AIDS-associated Hospitalizations (NYS)
59.1 hospitalizations per 1,000 PLWDH (2017)
Measures: Number of HIV/AIDS-related hospitalizations, rate of HIV/AIDS-related hospitalizations among total pop, rate of HIV/AIDS-related hospitalizations among PLWDH
Years: 2009 – 2017
Geographic levels: NYS statewide, Ryan White Region, county
Filters: sex, age, race/ethnicity