Ending the Epidemic
  • ABOUT
    • About ETE
    • Data Sources
    • Acronyms
    • In the News
  • DATA
    • Directory
    • ETE Metrics
    • Community Snapshot
  • IMPLEMENTATION
    • ETE Policy Tracker
    • ETE Programs in NYC
  • BLOG
  • RESOURCES
    • Infographics
  • Sign Up
  • Post
  • Newly released 2020 HIV...

Newly released 2020 HIV Surveillance, PrEP utilization, and ETE Metrics data now available on the ETE Dashboard

By ETE Dashboard |

December 1st, 2021 |

Categories:

AnnouncementsBlog
|

Tags: |

0 Comments

  • Facebook
  • Twitter
  • Linkedin

Newly released 2020 data is now available on the ETE Dashboard, including NYS and NYC HIV surveillance data and PrEP and PEP utilization annual/semi-annual data. An updated ETE Metrics page now includes data viewable by sex, age group, and race/ethnicity for select metrics.

Click on the links below to explore these newly updated interactive tools, including recently launched Dashboard pages showing trends in AIDS diagnoses, HIV/AIDS-associated hospitalizations, and HIV-related deaths.  Dashboard users can also navigate to this array of interactive visualizations using the Data Directory.

  • ETE Metrics
  • PrEP utilization
  • PEP utilization
  • Regional PrEP Aware Fact Sheets
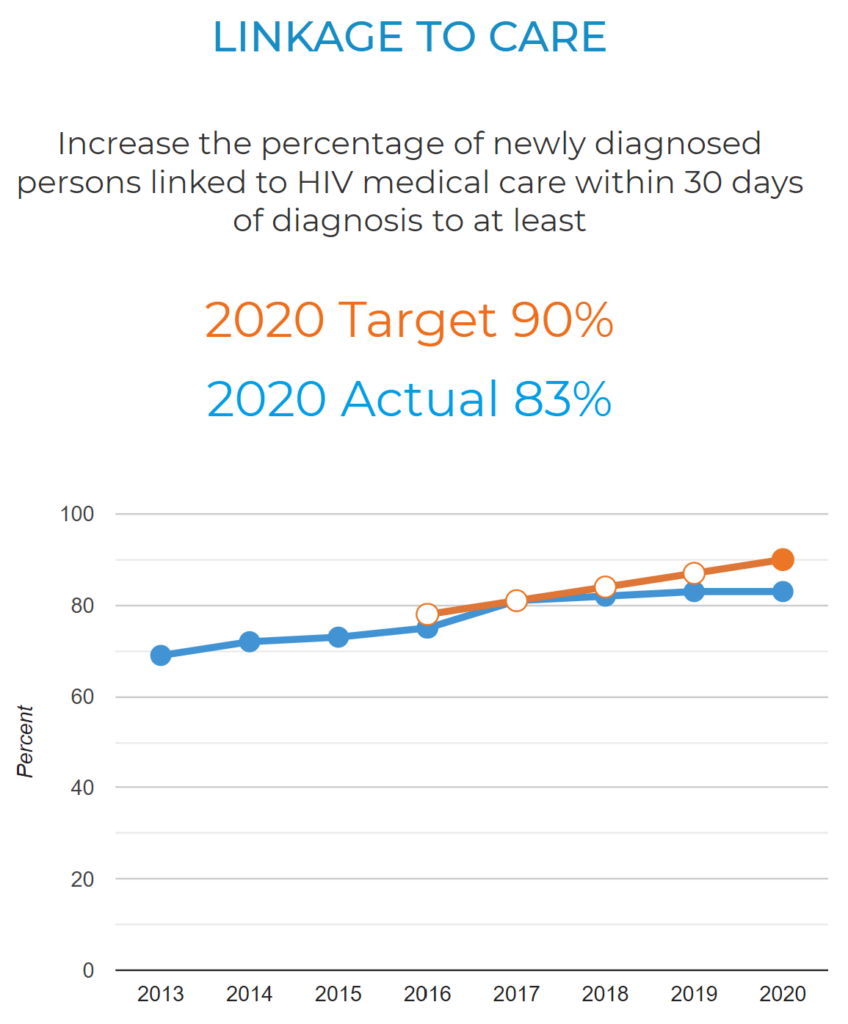
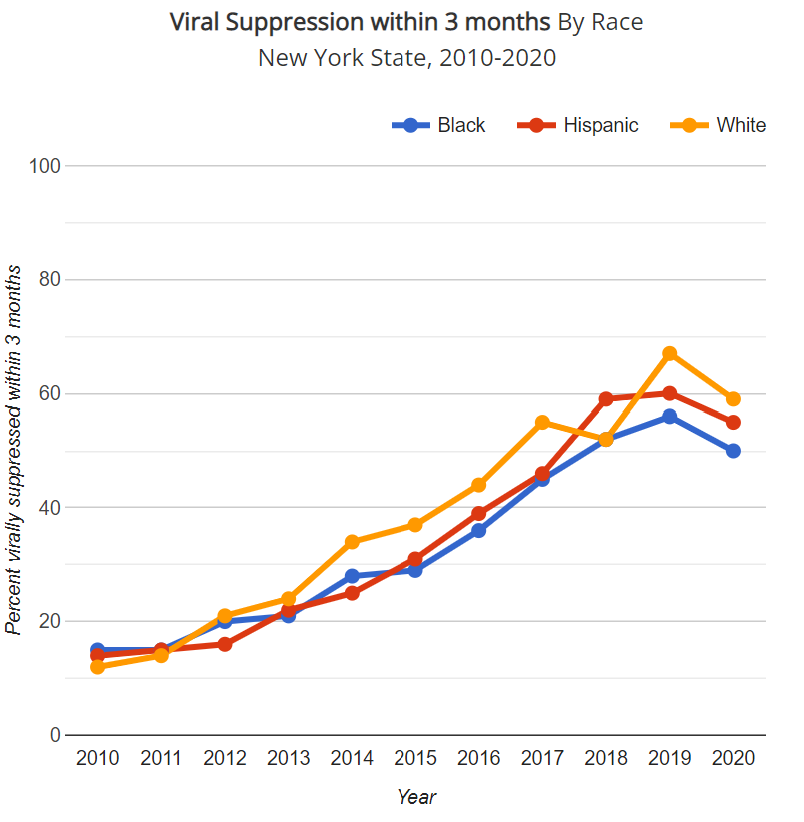
  • HIV Care Continuum among people living with HIV:                         NYS | NYC
  • HIV Care Continuum among people newly diagnosed with HIV:    NYS | NYC
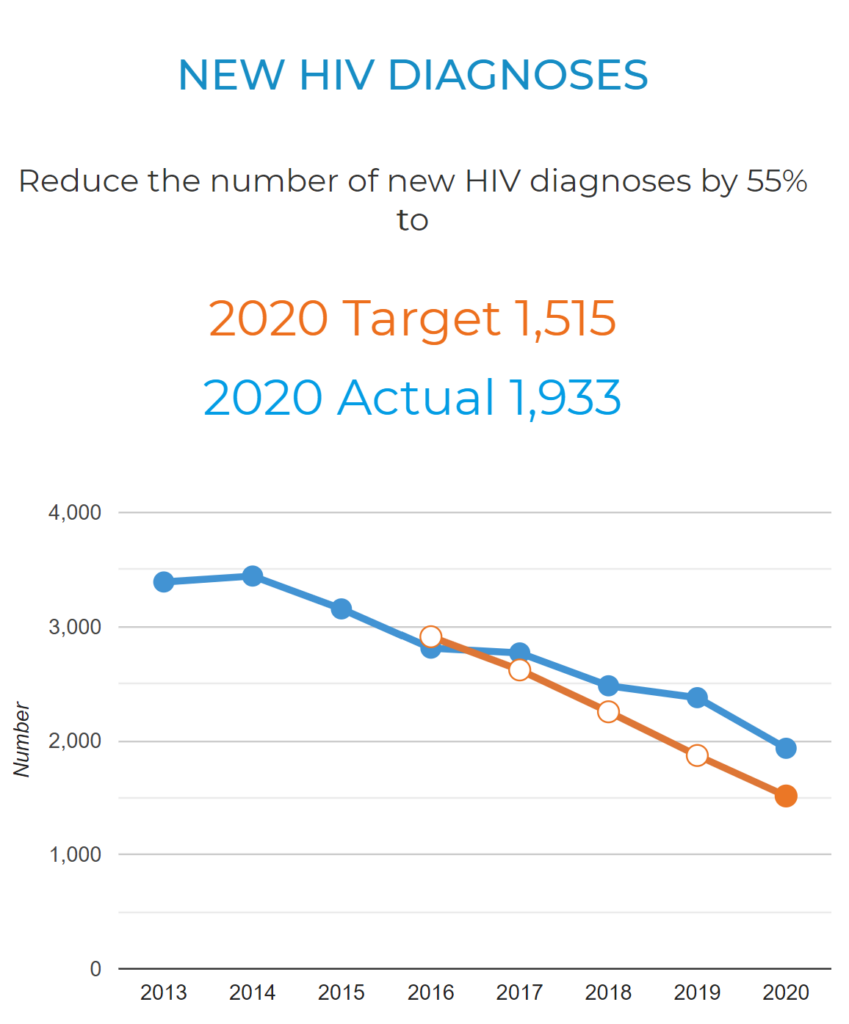
  • Trends among people with newly diagnosed HIV:                            NYS | NYC
  • Trends among people newly diagnosed with AIDS (new)
  • Trends in HIV-related deaths in New York City (new)
  • HIV/AIDS-associated hospitalizations1 (new)

Note that data for the year 2020 should be interpreted with caution due to the impact of the COVID-19 pandemic on access to HIV testing, care-related services, and case surveillance activities.

Stay tuned for additional blog posts and updates related to overall ETE progress in New York and the 2020 data in the coming weeks.

1 Data source: New York Statewide Planning and Research Cooperative System (SPARCS), reported as of June 2019. Due to the impact of Covid-19, most recent available publicly available hospitalization data displayed on the ETE Dashboard is through year 2017.

Post navigation

Previous
Next

Search

Navigation

  • 2025
    • April
    • March
    • February
  • 2024
    • December
    • October
    • September
    • June
    • May
    • April
    • March
    • February
    • January
  • 2023
    • December
    • November
    • October
    • September
    • August
    • June
    • May
    • April
    • March
    • January
  • 2022
    • December
    • November
    • October
    • September
    • June
    • May
    • April
    • March
    • February
  • 2021
    • December
    • November
    • October
    • September
    • May
    • March
    • February
  • 2020
    • December
    • November
    • October
    • September
    • April
    • March
    • February
  • 2019
    • December
    • November
    • September
    • July
    • June
    • May
    • March
    • February
  • 2018
    • December
    • October
    • September
    • July
    • June
    • May
    • April
    • February
    • January
  • 2017
    • December
    • November
    • October
    • September
    • August
    • July
    • June
    • May
    • February
    • January
  • 2016
    • December
    • November
    • October
    • September
    • August
    • July
    • June
    • May
    • April
    • February
  • 2015
    • December
    • November
    • October
    • September

We want to hear from you!

Give us your feedback

about the ETE Dashboard

DESIGNED AND DEVELOPED BY:
CUNY Institute for Implementation Science in Population Health
FUNDED BY:
CONNECT WITH US:

Subscribe to get updates:

Subscribe

* indicates required
/* real people should not fill this in and expect good things – do not remove this or risk form bot signups */

Intuit Mailchimp

For general inquiries email:
info@etedashboardny.org