Login
/
Sign up
Ending the Epidemic Logo
  • ABOUT
    • About ETE
    • Data Sources
    • Acronyms
  • DATA
    • Directory
    • ETE Metrics
    • Prevention
    • New Infections
    • Testing
    • New Diagnoses and Linkage
    • Prevalence and Care
    • AIDS Diagnoses
    • Deaths and Hospitalizations
  • IMPLEMENTATION
    • ETE Policy Tracker
    • ETE Programs in NYC
  • BLOG
  • RESOURCES
    • Infographics
  • Post
  • Newly released New York...

Newly released New York State HIV Surveillance, ETE Metrics, and PrEP use data

By ETE Dashboard |

December 4th, 2019 |

Categories:

Blog
|

Tags: |

0 Comments

  • Facebook
  • Twitter
  • Linkedin

2018 New York State HIV Surveillance data is now available on the ETE Dashboard

Click on the links below to view these newly updated interactive tools to view NYS care continua and trends by Ryan White Region or county, with options to filter the data by sex, age, race/ethnicity, and transmission risk group where available.

  • HIV Care Continuum among all people living with HIV
  • HIV Care Continuum among people with newly diagnosed HIV
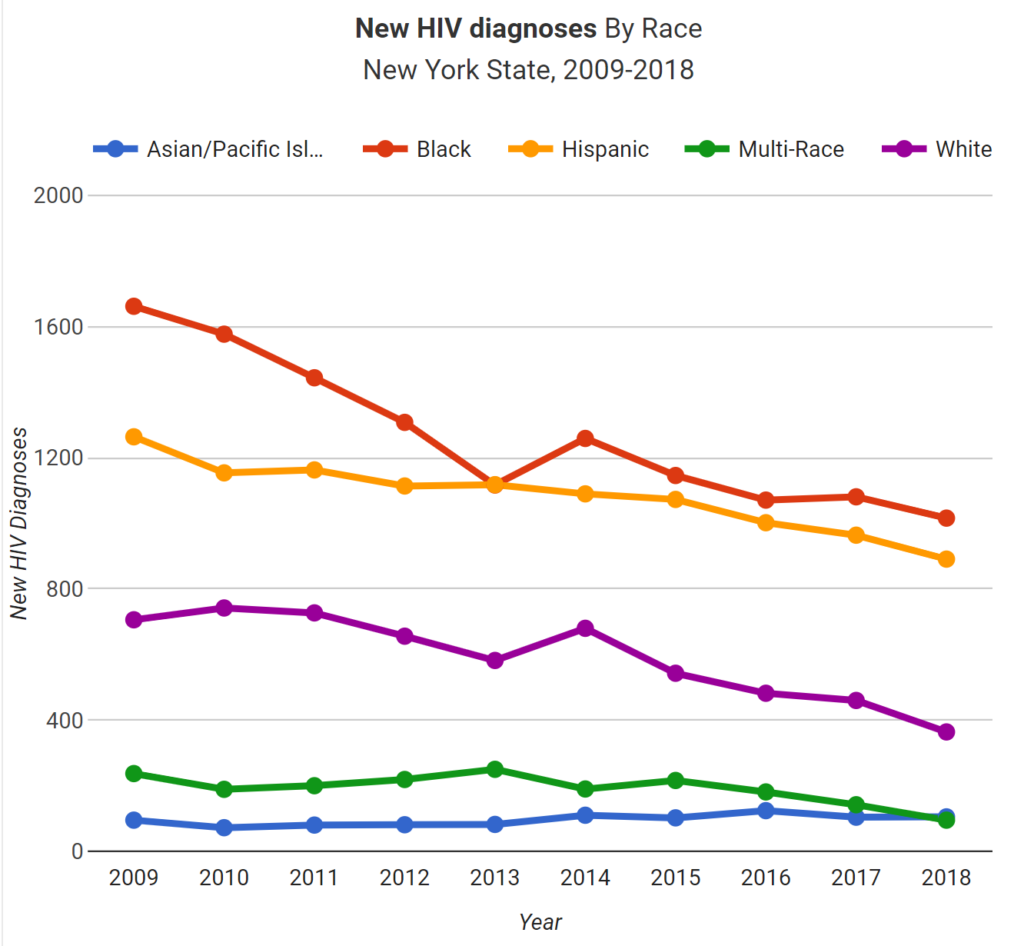
  • Trends among people with newly diagnosed HIV
  • Median CD4 count trends among people with newly diagnosed HIV
  • PrEP use in NYS
  • PEP use in NYS

In addition to these data visualizations and the launch of the ETE Policy Tracker, we’ve also updated the Dashboard’s ETE Metrics page with 2018 data, where stakeholders can track recent trends against annual targets.  The latest version now includes the ETE Metric, HIV related deaths, and stay tuned for a new feature coming soon that will display New York City data for each metric.

Post navigation

Previous
Next

Leave a Reply Cancel reply

You must be logged in to post a comment.

Navigation

  • 2022
    • May
    • April
    • March
    • February
  • 2021
    • December
    • November
    • October
    • September
    • May
    • March
    • February
  • 2020
    • December
    • November
    • October
    • September
    • April
    • March
    • February
  • 2019
    • December
    • November
    • September
    • July
    • June
    • May
    • March
    • February
  • 2018
    • December
    • October
    • September
    • July
    • June
    • May
    • April
    • February
    • January
  • 2017
    • December
    • November
    • October
    • September
    • August
    • July
    • June
    • May
    • February
    • January
  • 2016
    • December
    • November
    • October
    • September
    • August
    • July
    • June
    • May
    • April
    • February
  • 2015
    • December
    • November
    • October
    • September
DESIGNED AND DEVELOPED BY:

CUNY Institute for Implementation Science in Population Health

FUNDED BY:

New York State Department of Health

CONTACT:

CUNY ISPH
55 W 125th Street, New York, NY 10027
feedback@etedashboardny.org

Facebook instagram Twitter