Ending the Epidemic
  • ABOUT
    • About ETE
    • Data Sources
    • Acronyms
    • In the News
  • DATA
    • Directory
    • ETE Metrics
    • Community Snapshot
  • IMPLEMENTATION
    • ETE Policy Tracker
    • ETE Programs in NYC
  • BLOG
  • RESOURCES
    • Infographics
  • Sign Up
  • Post
  • Newly released New York...

Newly released New York City HIV surveillance data on the ETE Dashboard

By ETE Dashboard |

December 2nd, 2019 |

Categories:

Blog
|

Tags: |

0 Comments

  • Facebook
  • Twitter
  • Linkedin

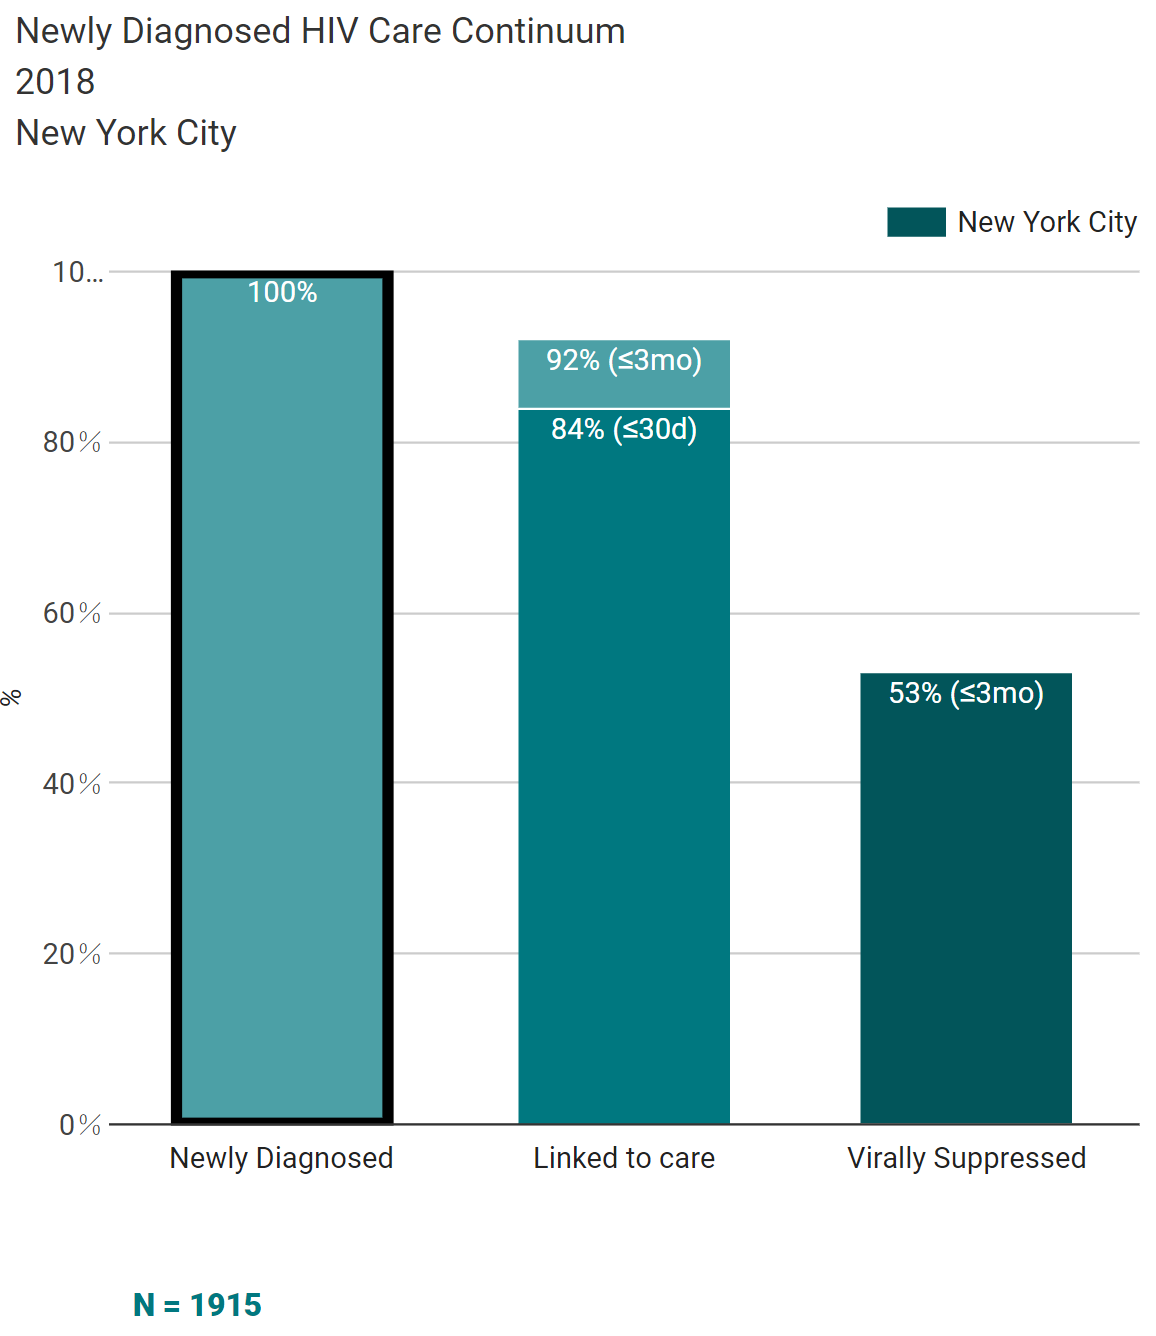
Newly released HIV surveillance data from the New York City Department of Health and Mental Hygiene show that 1,915[1] people were diagnosed with HIV in New York City in 2018, marking the first time the number fell below 2,000 since annual HIV reporting began in 2001.  Among the 1,915 persons with newly diagnosed HIV, 84% were linked to care within 30 days of diagnosis and 53% were virally suppressed within 3 months.

While the data highlights New York City’s considerable progress towards achieving the goals of New York State’s initiative to End the AIDS Epidemic by the end of 2020, notable disparities persist among those with newly diagnosed HIV:

  • The proportion linked to care within 30 days was lowest among women (80%), people ages 40-49 (80%), Black people (81%), and people with a history of injection drug use (79%).
  • The proportion virally suppressed within 3 months of diagnosis was lowest among transgender people (46%) and among people with a history of injection drug use (50%).

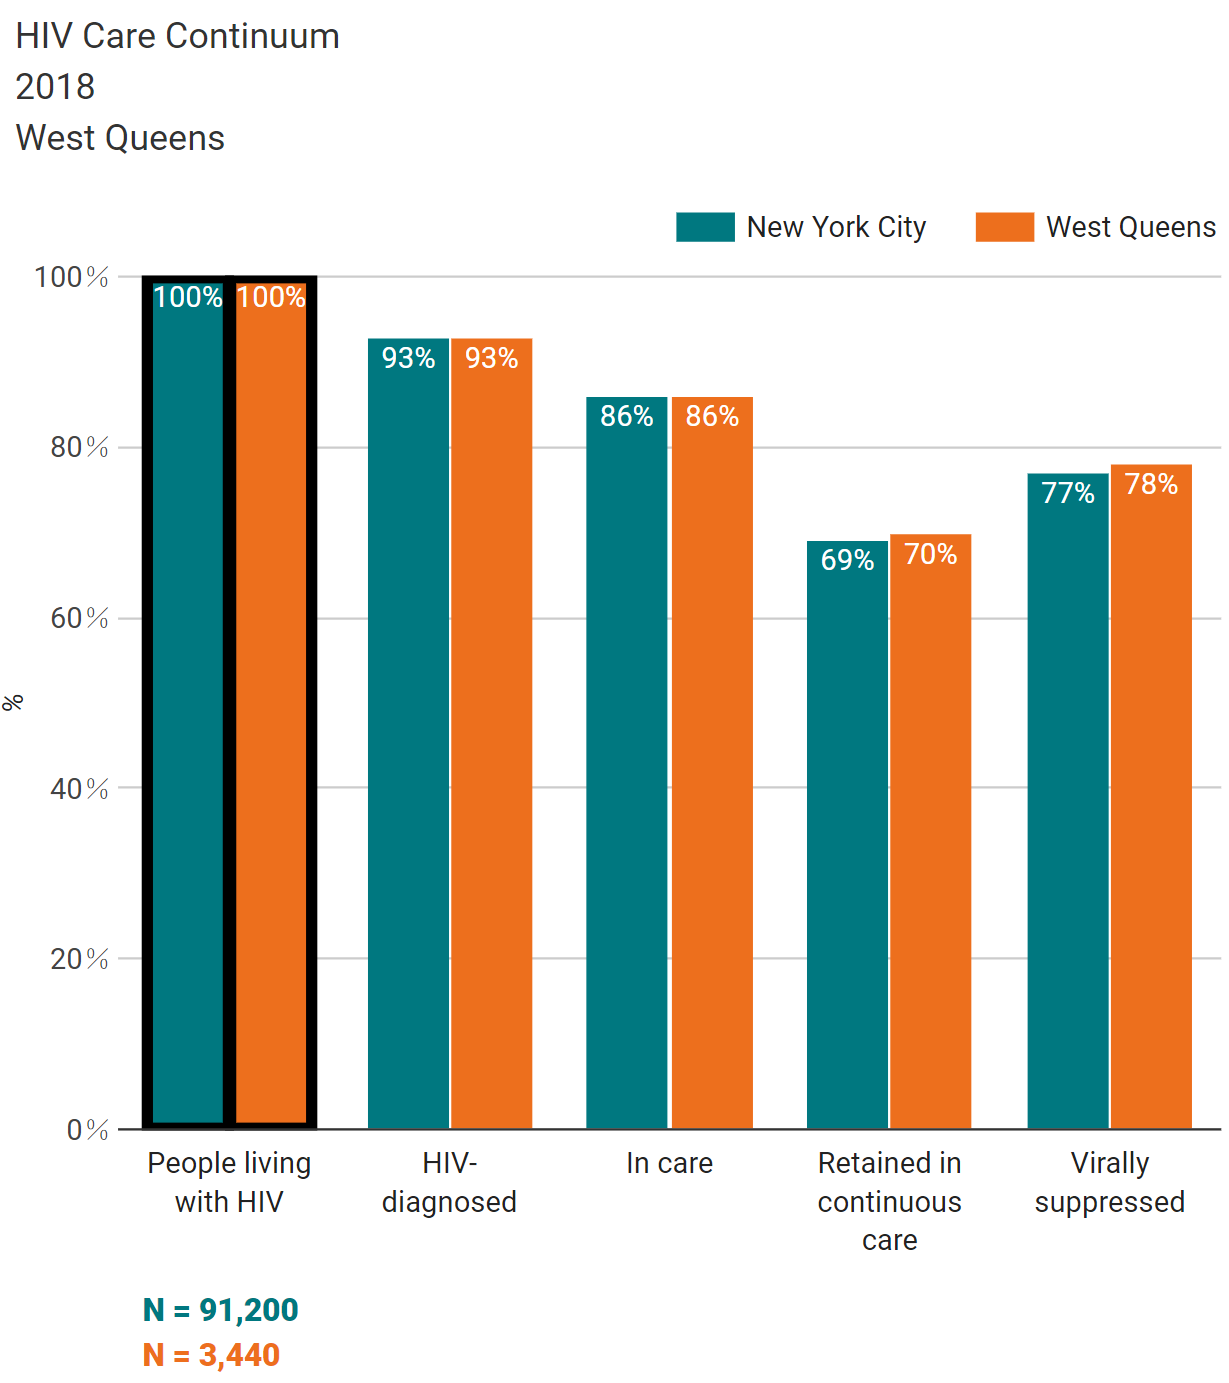
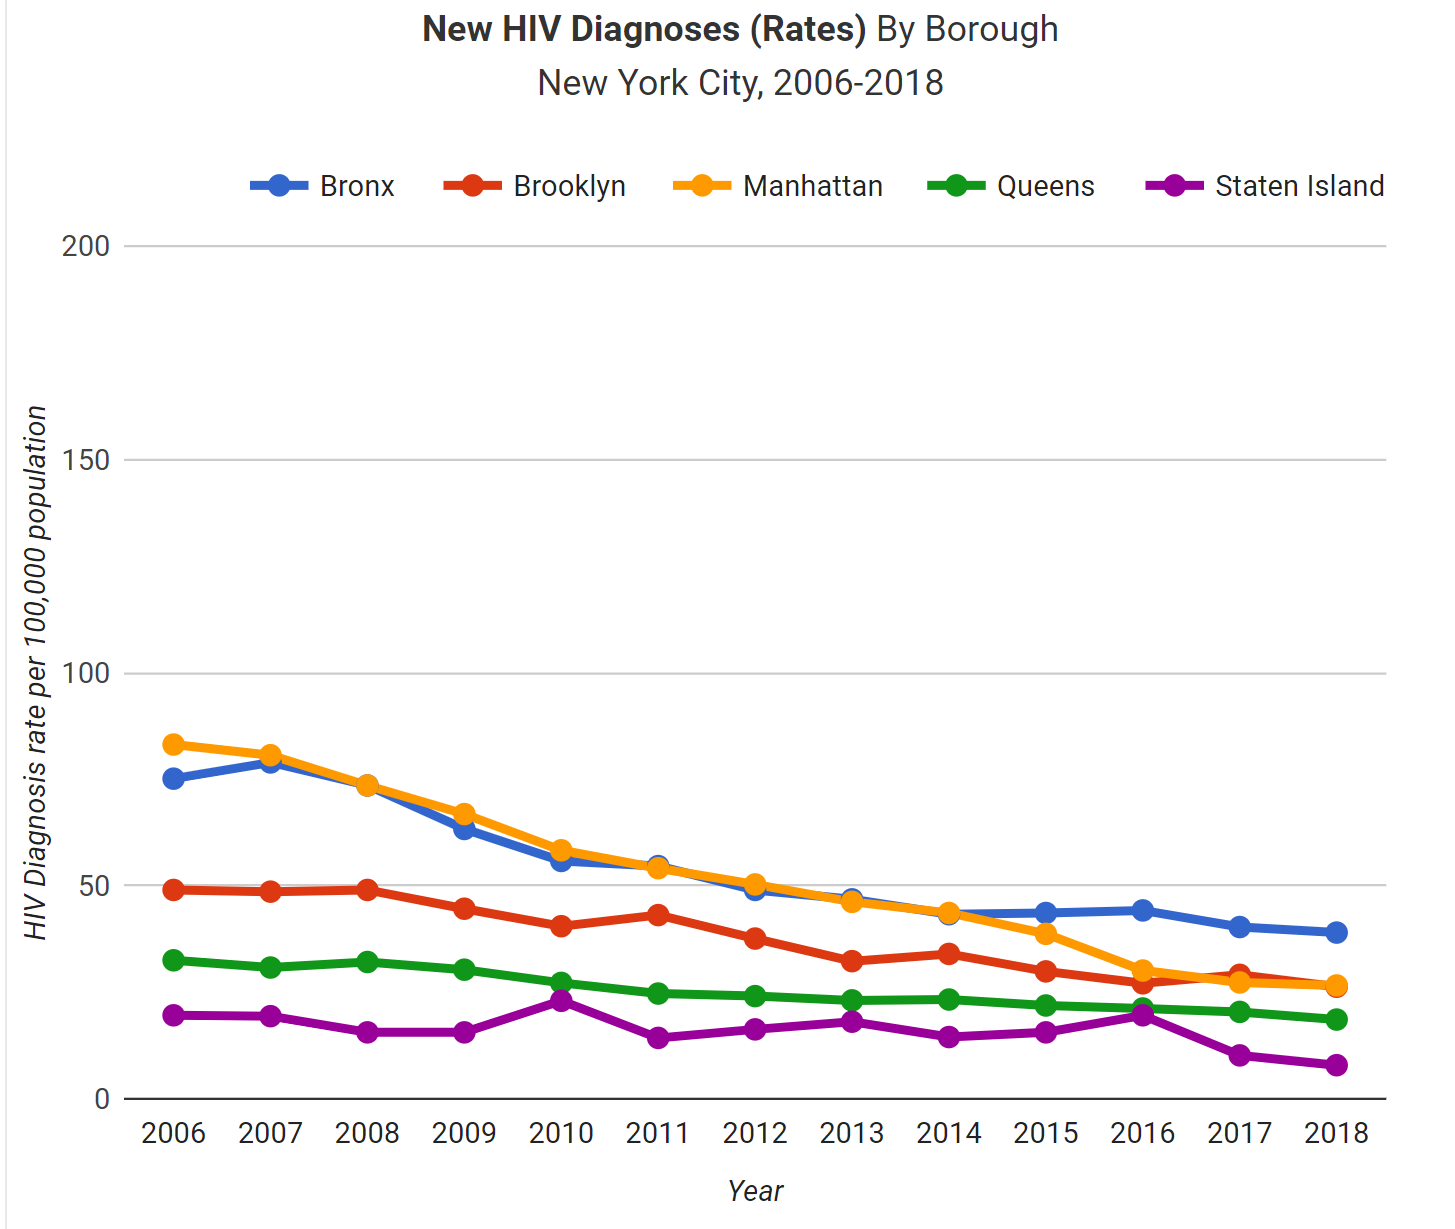
In keeping with our charge to make timely and relevant data accessible to all ETE stakeholders, we have updated three of our interactive NYC data visualizations with the updated 2018 surveillance data.  These tools (links to each page below) allow ETE Dashboard users to view care continua and trends by borough or UHF neighborhood, and by demographic and transmission risk group when available.

  1. HIV Care Continuum among all people living with HIV
  2. HIV Care Continuum among people with newly diagnosed HIV
  3. Trends among people with newly diagnosed HIV

Stay tuned for more updates from the ETE Dashboard later this week, including 2018 NYS statewide, region, and county level surveillance data, updates to the ETE Metrics page, and the launch of an exciting new visualization tool of great importance to the ETE initiative.

More example visualizations from the updated NYC data release:

[1] Data reported to the NYC DOHMH HIV Epidemiology and Field Services Program by March 31, 2019.  Data includes people all ages 13 and older, which explains slight differences between these numbers and data published elsewhere by NYC DOHMH.

Post navigation

Previous
Next

Leave a Reply Cancel reply

You must be logged in to post a comment.

Search

Navigation

  • 2025
    • April
    • March
    • February
  • 2024
    • December
    • October
    • September
    • June
    • May
    • April
    • March
    • February
    • January
  • 2023
    • December
    • November
    • October
    • September
    • August
    • June
    • May
    • April
    • March
    • January
  • 2022
    • December
    • November
    • October
    • September
    • June
    • May
    • April
    • March
    • February
  • 2021
    • December
    • November
    • October
    • September
    • May
    • March
    • February
  • 2020
    • December
    • November
    • October
    • September
    • April
    • March
    • February
  • 2019
    • December
    • November
    • September
    • July
    • June
    • May
    • March
    • February
  • 2018
    • December
    • October
    • September
    • July
    • June
    • May
    • April
    • February
    • January
  • 2017
    • December
    • November
    • October
    • September
    • August
    • July
    • June
    • May
    • February
    • January
  • 2016
    • December
    • November
    • October
    • September
    • August
    • July
    • June
    • May
    • April
    • February
  • 2015
    • December
    • November
    • October
    • September

We want to hear from you!

Give us your feedback

about the ETE Dashboard

DESIGNED AND DEVELOPED BY:
CUNY Institute for Implementation Science in Population Health
FUNDED BY:
CONNECT WITH US:

Subscribe to get updates:

Subscribe

* indicates required
/* real people should not fill this in and expect good things – do not remove this or risk form bot signups */

Intuit Mailchimp

For general inquiries email:
info@etedashboardny.org