Ending the Epidemic
  • ABOUT
    • About ETE
    • Data Sources
    • Acronyms
  • DATA
    • Directory
    • ETE Metrics
    • Community Snapshot
  • IMPLEMENTATION
    • ETE Policy Tracker
    • ETE Programs in NYC
  • BLOG
  • RESOURCES
    • Infographics
  • Sign Up
  • Post
  • Newly released 2019 HIV...

Newly released 2019 HIV testing and condom use data now available on the ETE Dashboard

By ETE Dashboard |

October 25th, 2021 |

Categories:

Blog
|

Tags: |

0 Comments

  • Facebook
  • Twitter
  • Linkedin

HIV testing in New York State

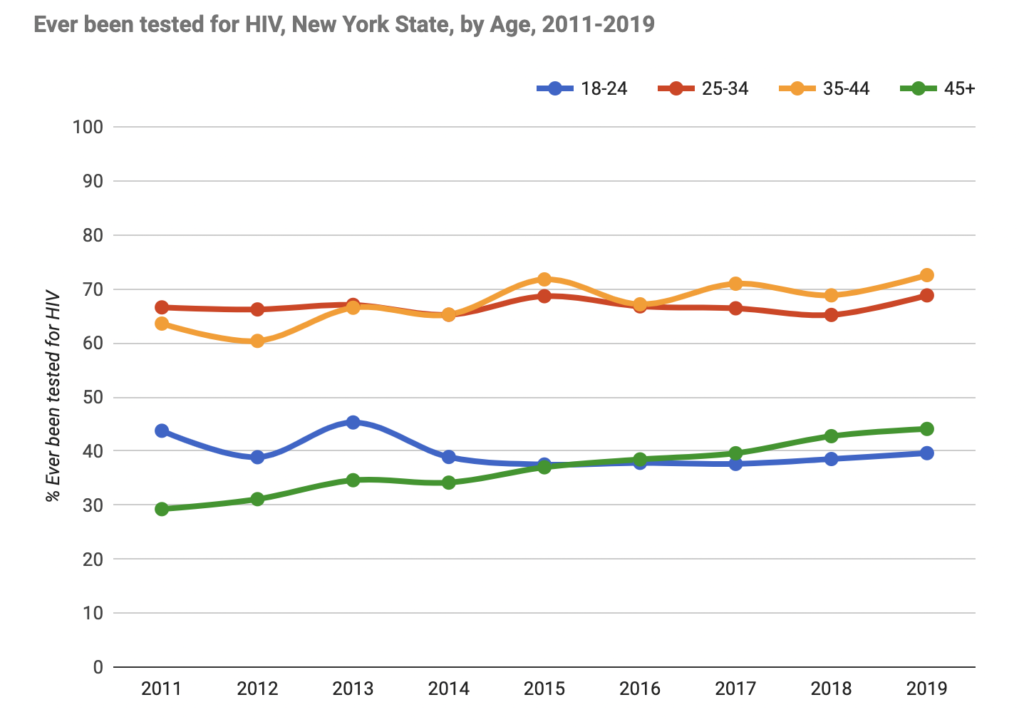
In 2019, 53% of people in New York State reported having ever been tested for HIV [1], a 7% increase from 2014 when the Ending the Epidemic (ETE) initiative was announced. HIV testing varies greatly by age and race/ethnicity, as HIV testing rates are continually highest among persons 25-44 and among Black and Hispanic New Yorkers. Users can explore these data by visiting the newly updated NYS HIV testing visualization page, where trends in HIV testing are viewable by sex, age, race/ethnicity, and region. 

HIV testing and condom use in New York City

In 2019, 34% of NYC residents reported having been tested for HIV in the preceding 12 months, and 29% reported using a condom the last time they had sex [2].  HIV testing data in NYC are viewable at the citywide, borough, and UHF neighborhood level and can be stratified by sex, race/ethnicity, age, and risk (e.g. among men who report having sex with men). Visit the Dashboard’s interactive NYC HIV testing page to explore these data, now available through 2019. 

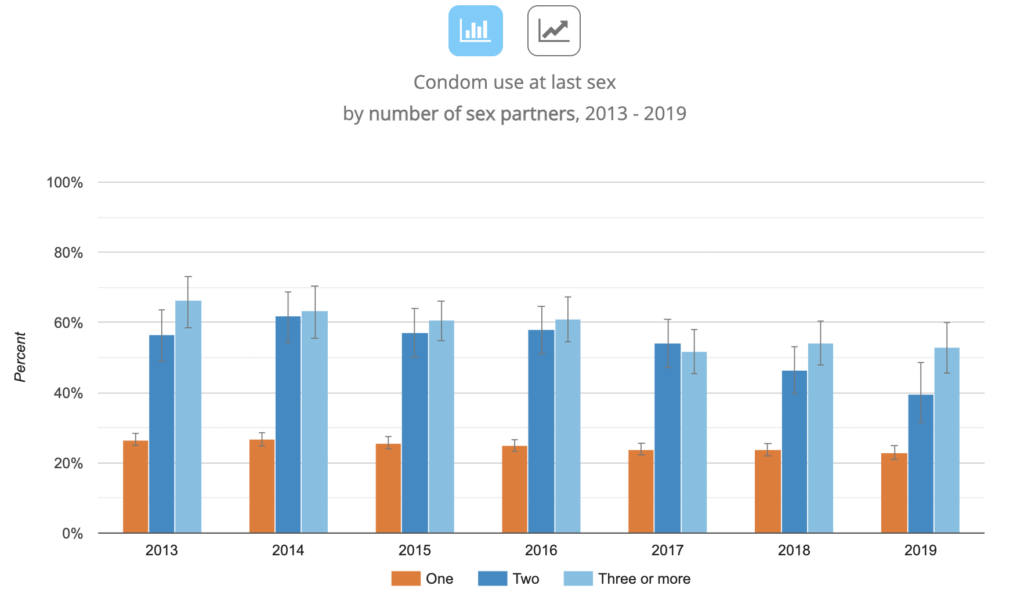
Condom use is measured as the percentage of respondents who used a condom the last time they had sex. Users can now explore condom use data by sex, age, race/ethnicity, borough, number of sex partners, and risk (among men who report having sex with men).

While the percentage of NYC residents using condoms during sex has declined steadily in recent years, HIV testing rates remain relatively constant. 

[1] NYS Behavioral Risk Factor Surveillance System (BRFSS) 

[2] NYC Community Health Survey

Post navigation

Previous
Next

Search

Navigation

  • 2025
    • April
    • March
    • February
  • 2024
    • December
    • October
    • September
    • June
    • May
    • April
    • March
    • February
    • January
  • 2023
    • December
    • November
    • October
    • September
    • August
    • June
    • May
    • April
    • March
    • January
  • 2022
    • December
    • November
    • October
    • September
    • June
    • May
    • April
    • March
    • February
  • 2021
    • December
    • November
    • October
    • September
    • May
    • March
    • February
  • 2020
    • December
    • November
    • October
    • September
    • April
    • March
    • February
  • 2019
    • December
    • November
    • September
    • July
    • June
    • May
    • March
    • February
  • 2018
    • December
    • October
    • September
    • July
    • June
    • May
    • April
    • February
    • January
  • 2017
    • December
    • November
    • October
    • September
    • August
    • July
    • June
    • May
    • February
    • January
  • 2016
    • December
    • November
    • October
    • September
    • August
    • July
    • June
    • May
    • April
    • February
  • 2015
    • December
    • November
    • October
    • September

We want to hear from you!

Give us your feedback

about the ETE Dashboard

DESIGNED AND DEVELOPED BY:
CUNY Institute for Implementation Science in Population Health
FUNDED BY:
CONNECT WITH US:

Subscribe to get updates:

Subscribe

* indicates required
/* real people should not fill this in and expect good things – do not remove this or risk form bot signups */

Intuit Mailchimp

For general inquiries email:
info@etedashboardny.org