Interactive NYC HIV Care Continuum Visualizations of People Newly Diagnosed and Living with HIV, 2014-15
Newly released data from the New York City Department of Health and Mental Hygiene’s (NYC DOHMH) HIV Epidemiology and Field Services Program show that of the estimated 87,520 HIV-infected people living in NYC in 2015, 86% received some clinical care1, and 74% were virally suppressed at their most recent viral load test in 20152.
 To help you explore and use these newly available data, the ETE Dashboard Team is pleased to announce the launch of two new interactive data visualizations to further disseminate information on progress towards achieving the End of the AIDS Epidemic in New York:
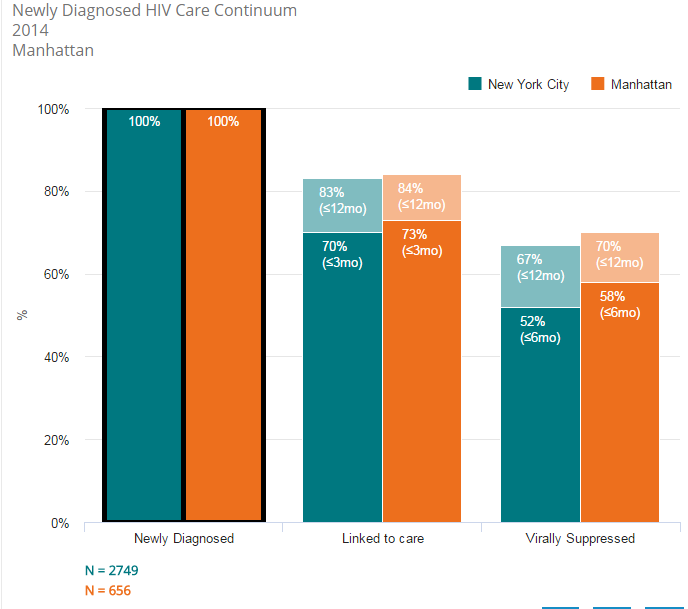
- HIV care continuum of people newly diagnosed with HIV in New York City
- HIV care continuum of people living with HIV in New York City
Click on the links below to make your own custom HIV care continuum and share it on social media!NYC HIV Care Continuum - Central Harlem, ages 20-29 pic.twitter.com/Toy9W2tzQ3 https://t.co/piHjdjQSjn
— Ending the Epidemic (@EtEDashboardNY) February 14, 2017
- HIV care continuum of people newly diagnosed with HIV in New York City
- HIV care continuum of people living with HIV in New York City