Ending the Epidemic
  • ABOUT
    • About ETE
    • Data Sources
    • Acronyms
  • DATA
    • Directory
    • ETE Metrics
    • Community Snapshot
  • IMPLEMENTATION
    • ETE Policy Tracker
    • ETE Programs in NYC
  • BLOG
  • RESOURCES
    • Infographics
  • Sign Up
  • Post
  • County- and region-level trends...

County- and region-level trends among persons with newly diagnosed HIV, 2008-2017

By ETE Dashboard |

July 23rd, 2019 |

Categories:

Blog
|

Tags: |

0 Comments

  • Facebook
  • Twitter
  • Linkedin

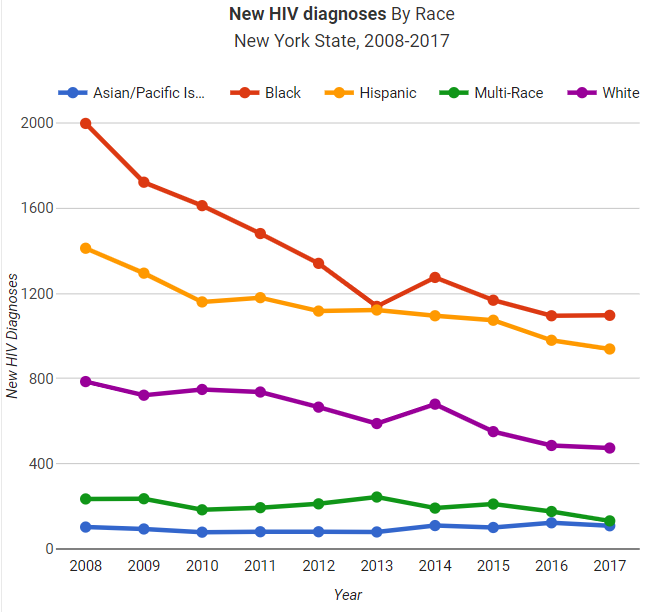
The number of persons with newly diagnosed HIV in New York State declined 39% between 2008-2017 (from 4,535 to 2,752).[1]  A new interactive visualization on the ETE Dashboard presents trends among persons with newly diagnosed HIV in New York at the county and Ryan White Region level.  Regional data is viewable by demographics (sex, age, race/ethnicity) or by transmission risk.

Users have the ability to view key HIV-related outcomes among people with newly diagnosed HIV such as concurrent HIV/AIDS diagnoses, timeliness of linkage to care and viral load suppression among persons with newly diagnosed HIV.  One of New York’s key statewide metrics to track progress toward Ending the Epidemic by the end of 2020 is to “increase the percentage of persons newly diagnosed with HIV who reach viral load suppression within 3 months of diagnosis to 75%.”  With this new tool, users will be able to view the progress among different populations toward reaching this goal.

CLICK HERE TO EXPLORE THE DATA

[1] All newly diagnosed individuals reported in this post and on the new visualization are aged 13 and over with known HIV stage. By this definition, the number of newly diagnosed cases and other measures reported on this page may slightly differ from numbers reported and published elsewhere.  Data source: NYS/DOH/AI Bureau of HIV/AIDS Epidemiology.

Post navigation

Previous
Next

Leave a Reply Cancel reply

You must be logged in to post a comment.

Search

Navigation

  • 2025
    • April
    • March
    • February
  • 2024
    • December
    • October
    • September
    • June
    • May
    • April
    • March
    • February
    • January
  • 2023
    • December
    • November
    • October
    • September
    • August
    • June
    • May
    • April
    • March
    • January
  • 2022
    • December
    • November
    • October
    • September
    • June
    • May
    • April
    • March
    • February
  • 2021
    • December
    • November
    • October
    • September
    • May
    • March
    • February
  • 2020
    • December
    • November
    • October
    • September
    • April
    • March
    • February
  • 2019
    • December
    • November
    • September
    • July
    • June
    • May
    • March
    • February
  • 2018
    • December
    • October
    • September
    • July
    • June
    • May
    • April
    • February
    • January
  • 2017
    • December
    • November
    • October
    • September
    • August
    • July
    • June
    • May
    • February
    • January
  • 2016
    • December
    • November
    • October
    • September
    • August
    • July
    • June
    • May
    • April
    • February
  • 2015
    • December
    • November
    • October
    • September

We want to hear from you!

Give us your feedback

about the ETE Dashboard

DESIGNED AND DEVELOPED BY:
CUNY Institute for Implementation Science in Population Health
FUNDED BY:
CONNECT WITH US:

Subscribe to get updates:

Subscribe

* indicates required
/* real people should not fill this in and expect good things – do not remove this or risk form bot signups */

Intuit Mailchimp

For general inquiries email:
info@etedashboardny.org