Ending the Epidemic Dashboard Launch!
Dear Ending the Epidemic (ETE) Stakeholder:
We are pleased to announce the launch of New York State's Ending the Epidemic (ETE) Dashboard system, a public facing website to broadly disseminate information on the progress of New York’s groundbreaking initiative to end the HIV epidemic!
The new ETE Dashboard system contains the latest information about New York State's HIV epidemic in visual format, including information on HIV prevention, HIV incidence, testing, new diagnoses and linkage, prevalence and care, AIDS diagnoses, and deaths, compiled from various data sources and presented in one place for ETE initiative stakeholders such as yourself. The ETE Dashboard also contains revised HIV care continua for 2013. As a key stakeholder in the ETE Initiative, you may want to create an account on the ETE Dashboard to receive ETE Dashboard-related communications and set other preferences to personalize your experience going forward.
Version 1.0 of the dashboard includes static content and some sections that are still under construction that will continue to be updated over the coming months. Version 2.0, planned for release in the winter of 2016, will introduce a more interactive data application, and more comprehensive data, including additional ETE-priority metrics. For example, users will be able to stratify and filter maps, graphs, and other visuals according to the sub-group (e.g. gender, age-group, risk) or geographic area of interest.
We hope that the ETE Dashboard will become a useful and powerful tool for all ETE initiative stakeholders and we encourage you to share this exciting launch announcement with your peers and colleagues. We include answers to frequently asked questions (FAQs) below, and welcome any feedback you may have to help improve the utility of the system (feedback@etedashboardny.org).
Sincerely,
Denis Nash, PhD, MPH
Project Director, ETE Dashboard System
Professor, Epidemiology and Biostatistics, Hunter College
Executive Officer, Doctor of Public Health Programs, School of Public Health
City University of New York
Frequently Asked Questions (FAQs)
What is New York State's ETE initiative?
On June 29, 2014, Governor Andrew M. Cuomo detailed a three-point plan to move us closer to the end of the AIDS epidemic in New York State. The goal is to reduce the number of new HIV infections to just 750 [from an estimated 3,000] by the end of 2020 and achieve the first ever decrease in HIV prevalence in New York State.
The three-point plan:
1. Identifies persons with HIV who remain undiagnosed and links them to health care.
2. Links and retains persons diagnosed with HIV in health care to maximize virus suppression so they remain healthy and prevent further transmission.
3. Facilitates access to Pre-Exposure Prophylaxis (PrEP) for persons engaged in high-risk behaviors to keep them HIV negative.

In support of the Governor's three-point plan, an ETE Task Force was established to develop and synthesize key recommendations to help move us towards ending the epidemic in New York State.
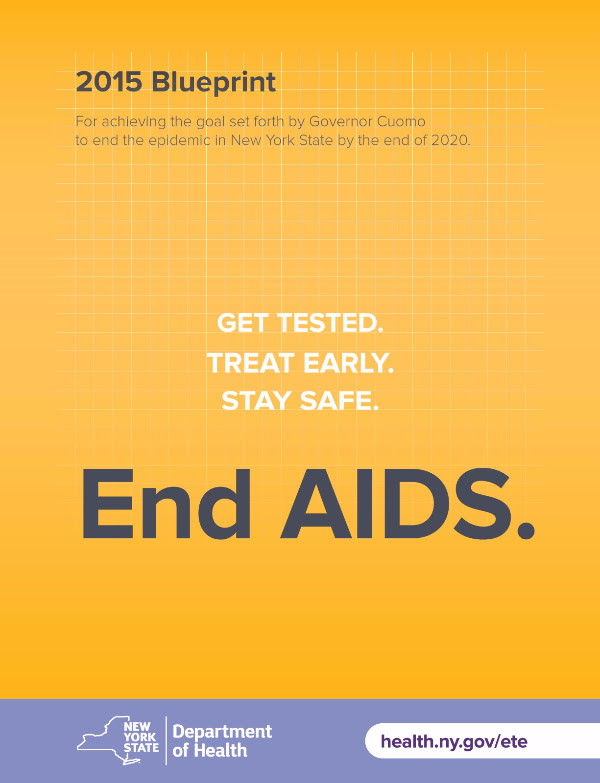
One of the key recommendations, presented in the 2015 Blueprint, is to extend and enhance the use of data to track and report progress on the Ending the Epidemic Initiative. Blueprint recommendation #29 calls for, The creation of a web-based, public facing Ending the Epidemic Dashboard to broadly disseminate information to stakeholders on the initiative's progress.
What is the purpose of the ETE Dashboard?
- To disseminate key metrics aligned with the ETE Blueprint Aims using a visual and interactive interface.
- To integrate and track related, but historically siloed data realms (i.e., prevention, HIV incidence, HIV testing, new diagnoses, prevalence and care, and morbidity and mortality) within geographic areas and within geographic, sociodemographic and epidemiological subgroups.
- To measure, track and disseminate actionable information on progress towards achieving goals to all interested stakeholders.
What information can I find on the ETE Dashboard?
The ETE Dashboard includes aggregate data from multiple data content realms (e.g., prevention, incidence, etc.) and data sources (e.g., surveillance data, Medicaid claims data, etc.). ETE Dashboard content is organized within the following data realms, across the continuum from HIV prevention to HIV-related deaths:
- HIV prevention (e.g., condom use, PrEP)
- New HIV infections
- HIV Testing
- New HIV diagnoses and linkage to care
- HIV prevalence and care-related outcomes
- New AIDS diagnoses
- Deaths among People Living with HIV Infection (including HIV-related deaths)
The AIDS Institute Bureau of HIV/AIDS Epidemiology (BHAE) recently completed updates to the 2013 New York State HIV Care Cascades. Until this year, all NYS HIV Surveillance reporting of persons living with diagnosed HIV infection has been based on residence at HIV or AIDS diagnosis. The new cascades include only persons whose most recent address is in NYS at the end of 2013; persons who appeared to have moved out of state and persons with no HIV-related event (laboratory report, surveillance report) for 5 years (AIDS) or 8 years (HIV not AIDS) before December 2013 and through January 2015 are excluded. BHAE's 2013 cascades provide a more accurate reflection of the HIV epidemic in New York State.
The ETE dashboard was designed and developed by a team at Hunter College and the School of Public Health of the City University of New York (CUNY). The ETE Dashboard project is funded by the New York State Department of Health, AIDS Institute, and is maintained by the CUNY team.
